Share this Image On Your Site
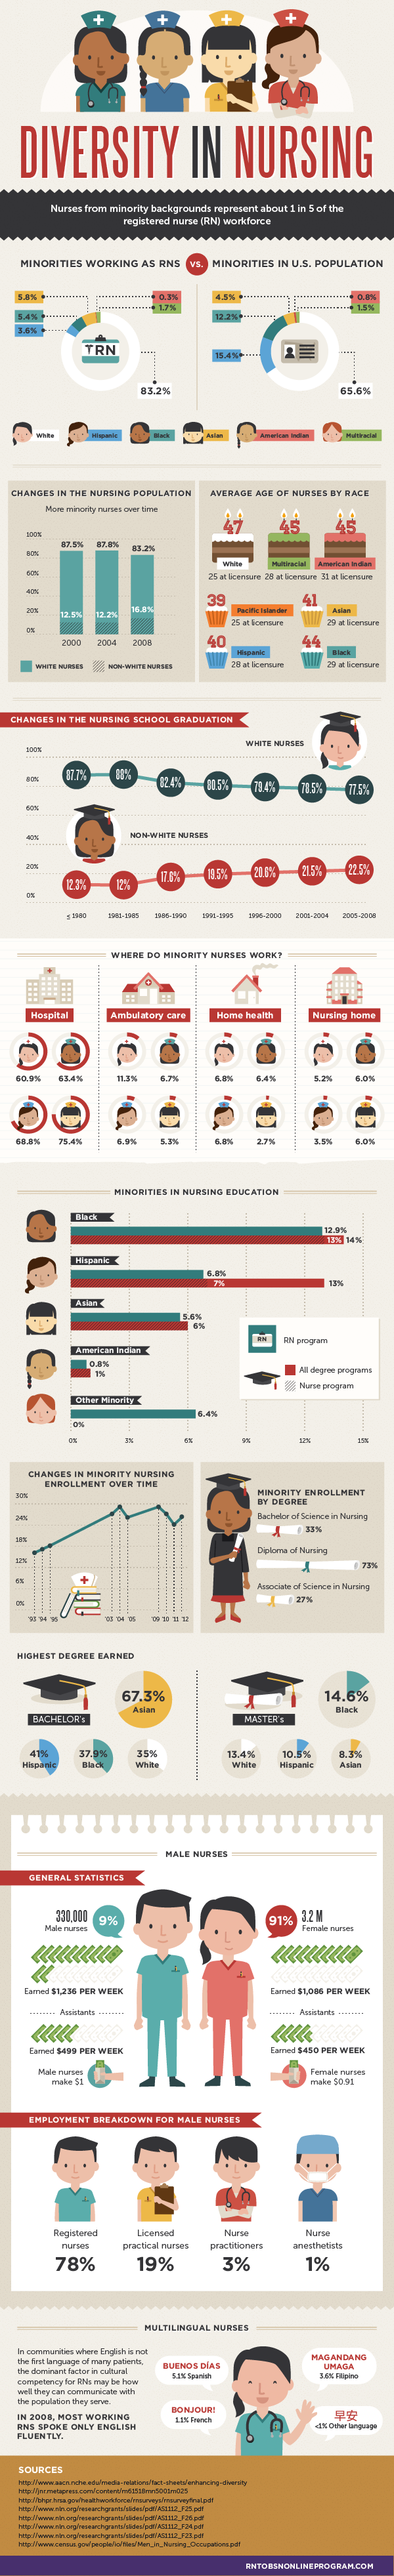
Minorities in Nursing
Minorities Working as RNs vs. Minorities in U.S. Population (http://bhpr.hrsa.gov/healthworkforce/rnsurveys/rnsurveyfinal.pdf pg 181)
Clearly the lack of minorities in nursing has nothing to do with a lack of minorities in general
- White: 83.2% RN, 65.6% US
- Hispanic: 3.6% RN, 15.4% US
- Black: 5.4% RN, 12.2% US
- Asian: 5.8% RN, 4.5% US
- American Indian: 0.3% RN, 0.8% US
- Multiracial: 1.7% RN, 1.5% US
Changes in the Nursing Population (http://bhpr.hrsa.gov/healthworkforce/rnsurveys/rnsurveyfinal.pdf pg 179)
More minority nurses over time
- 2000: 87.5% white, 12.5% non-white
- 2004: 87.8% white, 12.2% non-white
- 2008: 83.2% white, 16.8% non-white
Average Age of Nurses by Race (http://bhpr.hrsa.gov/healthworkforce/rnsurveys/rnsurveyfinal.pdf pg 182)
“The age profile of the RN workforce differs by racial/ethnic group. White, non-Hispanic RNs are the oldest racial/ethnic category of Registered Nurses (RNs) working in nursing yet they were the youngest group at the time of their initial licensure. Nearly all other racial/ethnic groups were slightly older at the point of initial licensure but were slightly younger than White, non-Hispanic nurses in the 2008 workforce.”
- White: 25 at licensure, 47 now
- Pacific Islander: 25 at licensure, 39 now
- Hispanic: 28 at licensure, 40 now
- Multiracial: 28 at licensure, 45 now
- Asian: 29 at licensure, 41 now
- Black: 29 at licensure, 44 now
- American Indian: 31 at licensure, 45 now
Changes in the Nursing School Graduation (http://bhpr.hrsa.gov/healthworkforce/rnsurveys/rnsurveyfinal.pdf pg 179)
More minority nursing grads over time
- 1980 or earlier: 87.7% white, 12.3% non-white
- 1981-1985: 88% white, 12% non-white
- 1986-1990: 82.4% white, 17.6% non-white
- 1991-1995: 80.5% white, 19.5% non-white
- 1996-2000: 79.4% white, 20.6% non-white
- 2001-2004: 78.5% white, 21.5% non-white
- 2005-2008: 77.5% white, 22.5% non-white
Where Do Minority Nurses Work? (http://bhpr.hrsa.gov/healthworkforce/rnsurveys/rnsurveyfinal.pdf pg 184)
Please just look at table 7-9 in link above on page listed. Tooooo much to copy
Minorities in Nursing Education
Minorities enrolled in basic RN programs by race (http://www.nln.org/researchgrants/slides/pdf/AS1112_F25.pdf)
- Black/African American = 12.9%
- Hispanic = 6/8%
- Asian/Pacific Islander = 5.6%
- American Indian = 0.8%
- Other Minority = 6.4%
Minority nursing enrollment vs. minority enrollment in all degree programs (http://www.nln.org/researchgrants/slides/pdf/AS1112_F26.pdf)
- Black/African American = 13% nursing, 14% total
- Hispanic = 7% nursing, 13% total
- Asian/Pacific Islander = 6% nursing, 6% total
- American Indian = 1% nursing, 1% total
Changes in minority nursing enrollment over time (http://www.nln.org/researchgrants/slides/pdf/AS1112_F24.pdf)
- 1993: 16%
- 1994: 17%
- 1995: 18%
- 2003: 27%
- 2004: 29%
- 2005: 26%
- 2009: 29%
- 2010: 27%
- 2011: 24%
- 2012: 26%
Minority enrollment by degree (http://www.nln.org/researchgrants/slides/pdf/AS1112_F23.pdf)
- Bachelor of Science in Nursing: 33%
- Diploma of Nursing: 73%
- Associate of Science in Nursing: 27%
Highest Degree Earned (http://bhpr.hrsa.gov/healthworkforce/rnsurveys/rnsurveyfinal.pdf pg 183)
***Interesting stats because minorities seem to be more educated than whites, in some regards. These are the stats for nursing graduates, not graduates in general***
BACHELOR’s
- White: 35%
- Black: 37.9%
- Hispanic: 41%
- Asian: 67.3%
MASTER’s
- White: 13.4%
- Black: 14.6%
- Hispanic: 10.5%
- Asian: 8.3%
Male Nurses
General Statistics (http://www.census.gov/people/io/files/Men_in_Nursing_Occupations.pdf)
- 9% of all nurses are men. 91% are women
- The above numbers break into 330,000 and 3.2 million
- In 2013, male registered nurses earned an average of $1,236 per week, while women earned $1,086 (http://www.bls.gov/cps/cpsaat39.pdf)
- Male nursing assistants (and certified medical assistants) earned about $499 a week, compared to $450 in women (same as above)
- In total, female nurses make $.91 to the $1 compared to male nurses
Employment Breakdown for Male Nurses (http://www.census.gov/people/io/files/Men_in_Nursing_Occupations.pdf)
- 78% registered nurses
- 19% licensed practical nurses
- 3% nurse practitioners
- 1% nurse anesthetists
Multilingual Nurses (http://bhpr.hrsa.gov/healthworkforce/rnsurveys/rnsurveyfinal.pdf pg 185)
Might want to throw in something about how there is a big demand for minority nurses in the south due to the high Hispanic, non-English speaking population there. “In communities where English is not the first language of many patients, the dominant factor in cultural competency for RNs may be how well they can communicate with the population they serve. In 2008, most working RNs spoke only English fluently. Just 5.1 percent of RNs spoke Spanish, and 3.6 percent spoke Tagalog or another Filipino language. About 1.1 percent spoke French, while less than 1 percent or RNs spoke any Chinese dialect, German, American Sign Language, or other language.”